Built for oil & gas engineers
AI Query, interactive well maps, operator benchmarking, formation analytics, type curve generation, and FracFocus chemical analysis — every feature designed around how reservoir engineers and land teams actually work.
AI Query Interface
Ask any production or completion question in plain English and get a structured answer in seconds. The AI understands basin terminology, operator names, formation aliases, and time-based queries — no SQL, no filters, no documentation to read.
How it works
- Type your question in natural language
- WellStrata translates it into a structured database query using your schema
- Results return as a ranked table, chart, or natural language summary
- Follow-up questions refine the result in context
Sample use case
"Show me Diamondback's Wolfcamp A wells in Midland County completed after 2021, ranked by 12-month cumulative oil" — answered in under 3 seconds with a sortable table and operator summary.
Wells Explorer
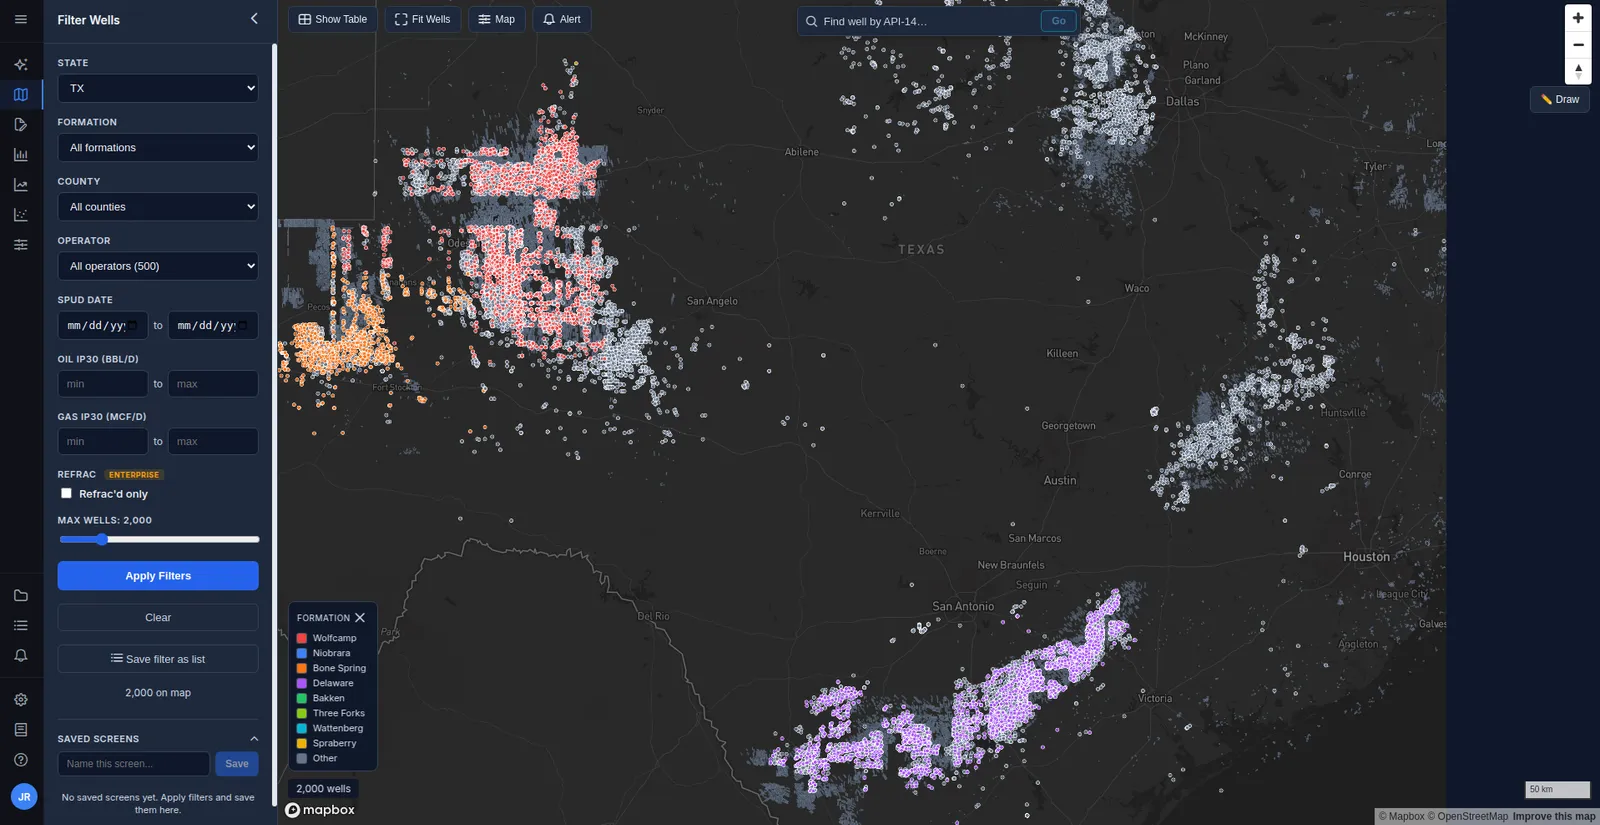
A full-screen interactive Mapbox map showing every well in the WellStrata database across all the states we cover. Wells are colored by formation, filterable by operator, county, status, and date range. Draw a polygon directly on the map to select all wells inside any acreage block.
How it works
- Pan and zoom across every state we cover
- Click any well dot to open a tabbed detail panel (production, completion, frac job)
- Use the polygon draw tool to instantly create a custom well screen
- Save named screens and share with your team
Sample use case
A land analyst draws a polygon around a target acreage block and instantly pulls all offset wells, their operators, formations, and production histories — without leaving the map.
Operator Benchmarking
Rank every active operator in any basin by IP30, cumulative oil, well count, and lateral length. Color-coded quartile rankings show at a glance who's in the top tier. Drill into any operator to see their formation mix, activity timeline, and top-performing wells.
How it works
- Select a state, formation, and date range
- View a ranked operator table with P25/P50/P75 quartile bands
- Click any operator to see their full well portfolio
- Compare two operators side-by-side on the same chart
Sample use case
A PE firm screens Permian operators before an acquisition — instantly ranking 40+ operators by median IP30 and identifying which ones are consistently in the top quartile across vintages.
Type Curve Builder
Generate P10/P50/P90 production decline curves for any combination of formation, operator, county, and completion vintage. Overlay multiple curve scenarios to compare expected performance. Export monthly rates as CSV for input into your own economic models. Available on the Standard plan and up.
How it works
- Select formation, operator (optional), county (optional), and vintage year range
- WellStrata aligns all matching wells on month-on-production (MOP 1 = first month of production)
- P10/P50/P90 curves calculated from the aligned dataset
- Export the full curve table as CSV with one click
Sample use case
A reservoir engineer building an AFE for a new Niobrara well pulls the P50 type curve for the same operator's last 3 vintages in Weld County — and finds EUR has improved 18% since 2021.
ML Production Forecasting
Go beyond peer type curves. Resery's machine-learning models forecast oil and gas production for existing and new wells — returning a P10/P50/P90 EUR and a full monthly decline curve from a well's design and formation. A Professional capability delivered inside WellStrata via API, powered by Resery — BIROVA's ML product for recovery decisions.
How it works
- Open any well and request an ML forecast from the detail panel
- Resery builds features from the well's completion and production history
- A trained decline model returns a P10/P50/P90 EUR and a monthly rate curve
- Also available programmatically via the API for planned-well scenarios
Sample use case
A reservoir engineer forecasts a proposed Wolfcamp infill from its planned lateral length and proppant loading — getting a P50 EUR with a downside/upside band in seconds, without hand-fitting a decline.
Refrac Intelligence
Find refracturing opportunities without spreadsheets. WellStrata flags wells that have already been refractured and lets you filter for them on the map, and — on any well — shows Resery's refrac uplift analysis: the do-nothing decline versus the post-refrac forecast and the incremental EUR (P10/P50/P90). An Enterprise capability, powered by Resery.
How it works
- Filter the Well Explorer to wells that have already been refractured
- Open the “Refrac insights” tab on any well detail
- Compare the base decline against the post-refrac forecast
- Read the incremental EUR band (P10/P50/P90) for the candidate
Sample use case
An asset team reviews a mature acreage block for refrac candidates — inspecting each well's base-vs-refrac curve and incremental EUR band before committing capital.
Formation Dashboard
Basin-level production intelligence for every major formation. See stacked monthly production history, wells drilled per year, top operators by cumulative output, and IP30 trends over time — all in a single dashboard per formation.
How it works
- Select any formation (Wolfcamp, Bakken, Woodford, Niobrara, etc.)
- View production history stacked by operator
- Track drilling activity trends and vintage performance
- Identify which operators are growing share vs. declining
Sample use case
An analyst tracking SCOOP/STACK activity pulls the Woodford Formation Dashboard and immediately sees which operators increased drilling in 2024 and which pulled back.
Chemicals Explorer
FracFocus data decoded and made queryable. Compare operators by water intensity (gallons per lateral foot), explore every chemical ingredient by CAS number with direct PubChem links, and track adoption trends for specific additives over time across any basin. Available on the Standard plan and up.
How it works
- Browse 116,000+ frac jobs linked to wells
- Filter by operator, formation, county, and date range
- Sort by water intensity, proppant loading, or total fluid volume
- Click any CAS number to view the chemical's PubChem safety profile
Sample use case
An environmental consultant reviews water intensity trends for Permian operators over the last 5 years — identifying a 12% reduction in water use per lateral foot across the basin.
Permits & Rig Activity
See where the rigs are headed before the wells show up in production data. A filterable drilling-permit map and table surfaces every recent permit filing, with a detail card on each one — operator, formation, county, status, and filing date. An analytics dashboard charts permit volume, formation mix, and operator momentum over time, and a "What's Changed" feed flags the plays, operators, and counties heating up or cooling versus their recent baseline. Track rig and permit activity across any basin as it develops. Available on the Standard plan and up; Professional adds instant ML EUR scoring on any new permit, and Enterprise adds new-permit email alerts for your areas of interest.
How it works
- Open the Permits view for a map and table of recent drilling permits
- Filter by operator, formation, county, status, and filing date
- Open the Analytics dashboard and "What's Changed" feed to see how activity is trending
- Click any permit for the full filing breakdown — and, on Professional, an expected-EUR estimate
- On Enterprise, set a new-permit alert to get an email when filings appear in your area
Sample use case
A land team monitoring a competitor watches new permit filings in Lea County — spotting a cluster of Bone Spring permits from one operator weeks before any production hits the state feeds, with an instant EUR estimate on each and an email the moment the next one is filed.
QC-Scored Data
Every production record, completion, and well header carries a composite quality score from 0–100, classified into Gold (90+), Silver (70–89), Bronze (50–69), and Flagged (<50) bands. Know exactly how much to trust each data point before you model it.
How it works
- Coordinate validation (distance from reported surface location)
- Operator name canonicalization (merge variants of the same company)
- Production anomaly detection (statistical outlier flagging)
- Formation assignment validation (cross-reference against completion depth)
Sample use case
A type curve analyst filters to Gold-scored wells only before building a P50 curve — eliminating 8% of records with suspect production data that would have skewed the EUR estimate.
Document Intelligence
Regulatory PDFs contain completion parameters that never appear in bulk state downloads. WellStrata's AI reads W-2 (Texas) and C-102 (New Mexico) completion reports and extracts stages, proppant volume, fluid type, and perforation intervals — enriching every well that has a filed completion document.
How it works
- Automated PDF download from TX RRC and NM OCD portals
- AI extracts structured fields: stages, proppant lbs, fluid gallons, perf intervals, TVD
- Extracted data linked to the well record with a source document reference
- QC score reflects extraction confidence
Sample use case
A completion engineer compares actual proppant loading vs. reported lateral length for 200 Wolfcamp B wells — data that only exists in the PDF filings and nowhere in the state's bulk downloads.
See the AI in action
Ask complex production questions in plain English — no SQL required.
How WellStrata works
From raw regulatory filings to AI-ready structured data — automated, auditable, and accurate.
Data ingested from state agencies
WellStrata automatically downloads production reports, wellbore databases, and completion filings from the Texas RRC, North Dakota DMR, New Mexico OCD, Colorado ECMC, and Wyoming WOGCC every month.
AI extracts from regulatory PDFs
Completion reports (W-2, C-102) contain critical frac parameters that are never in bulk downloads. Our AI extracts stages, proppant volume, fluid type, and perforation intervals from the PDFs themselves.
QC pipeline scores every record
Each record is enriched with canonical operator and formation names, coordinate validation, anomaly detection, and a composite quality score. Raw data and QC data are both preserved.
You query in plain English
Ask WellStrata anything. The AI translates your question into a structured API query, executes it, and returns results as a table, chart, or natural language summary — your choice.
Stop digging through state portals.
Start getting answers.
Join engineers and analysts at independent operators who use WellStrata to make faster, better-informed decisions on leases, completions, and acquisitions.
No credit card required for trial. Setup takes less than 2 minutes.